STI Charts Explained – Making Profit with STI Charts
STI Charts, ( Stock Trend Index ) is a complex algorithm designed to find the possible reversal point of any Stock. In other words STI Charts Target the possible Reversal point for the stock. Finding reversal or overbought oversold region of any stock is not easy and not risk free too. But by Following some rules of STI Charts it can done easily
The STI Chart Signals are divided into 3 categories
The Buying Range
STI < 10 ( Buy this stock )
STI < 5 ( Very safe to buy )
STI < 3 ( Extremely good opportunity to buy )
The Selling Range
STI > 90 ( Sell this stock )
STI > 95 ( Very safe to Sell )
STI > 97 ( Extremely good opportunity to Sell )
Example 1 :
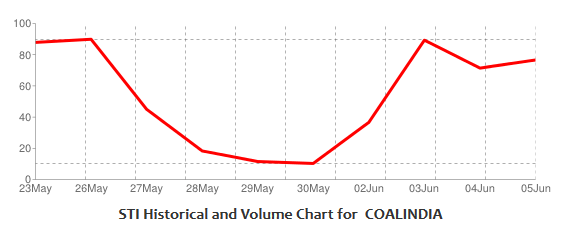
See STI Chart of COAL India. On 26 May it reach the Level of 90 and then Fall badly for next 5 day. Then on 30 May after touching Level of 10 it again bounced back and gave good Profit as per our Trading Rules
The STI Chart Signals are divided into 3 categories
The Buying Range
STI < 10 ( Buy this stock )
STI < 5 ( Very safe to buy )
STI < 3 ( Extremely good opportunity to buy )
The Selling Range
STI > 90 ( Sell this stock )
STI > 95 ( Very safe to Sell )
STI > 97 ( Extremely good opportunity to Sell )
Example 1 :
See STI Chart of COAL India. On 26 May it reach the Level of 90 and then Fall badly for next 5 day. Then on 30 May after touching Level of 10 it again bounced back and gave good Profit as per our Trading Rules
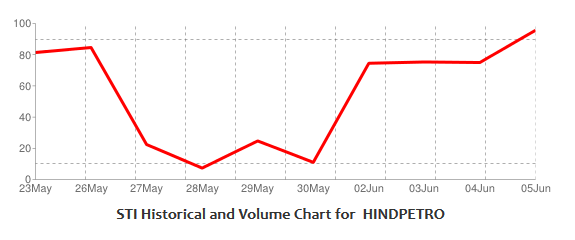
Example 2 :
Another Example of HindPetro. Stock reach the Level of 10 on 28 may and gave a Sharp pullback in Coming Day
Another Example of HindPetro. Stock reach the Level of 10 on 28 may and gave a Sharp pullback in Coming Day
STI Charts are Available at Rs 1000 per month and is suitable for Equity Traders who take Position for couple of days ( 4 to 10 Days ) to make quick profits.